2
"If you want to make an apple pie from scratch, you must first create the universe."
Carl Sagan
Chapter 1 - Background
This chapter contains a summary of the state of the art in augmented reality research and related technologies that are relevant to this dissertation. Some of this information has been developed during the period of my research and is included so comparisons can be made. First, an extended (from chapter 1) description and definition of augmented reality is presented, followed by a discussion of how it fits into the spectrum of virtual environments. The chapter then goes on to discuss various indoor and outdoor AR applications that have been developed, demonstrating the current state of the art. Following this is a discussion of the two techniques for performing real-time AR overlay, as well as a summary of the numerous types of tracking technologies employed. After these technologies have been explained, a history of human computer interaction techniques for desktop and virtual reality systems is then covered. Current techniques used for the capture of models in the physical world are then discussed, followed by a section summarising commercially available CAD software and solid modelling techniques. Finally, the problems of working outdoors with wearable computers are described, including how they can be used for mobile augmented reality.
1.1 Definition of augmented reality
When Sutherland proposed the concept of the Ultimate Display [SUTH65], his goal was to generate artificial stimulus that would give the user the impression that the experience is real. Instead of immersing the user into an artificial reality, a second approach is to augment the user’s senses with extra information, letting them experience both artificial and real stimulus simultaneously. In his excellent survey paper of the field, Azuma defines augmented reality systems as those that contain the following three characteristics [AZUM97a]:
· Combines real and virtual
Interactive in real-time
Registered in 3D
This
definition does not limit augmented reality to the use of head mounted displays
(allowing for monitors, projectors, and shutter glasses), but excludes
non-interactive media such as movies and television shows. This dissertation
focuses on mobile outdoor augmented reality, and therefore this chapter will
focus only on research related to head mounted displays.
|
|

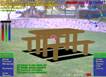
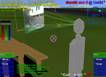
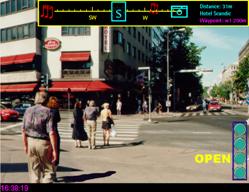
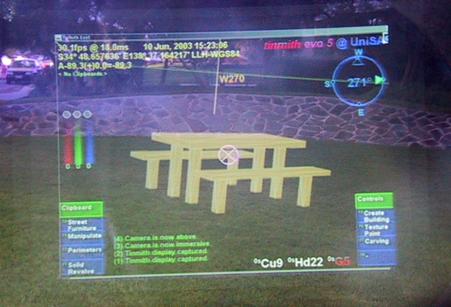
With the availability of real-time computer-generated 3D graphics, computers can render synthetic environments on a display device that can give the user the impression they are immersed within a virtual world. This technology is referred to as virtual reality (VR) and is designed to simulate with a computer the physical world humans normally can see. The opposite of VR is the real physical world typically experienced by a human, although it may be slightly attenuated because it is being viewed via a head mounted display or video camera. Augmented reality is therefore made up of a combination of virtual and real environments, although the exact make up of this may vary significantly. Milgram and Kishino used these properties to define a reality-virtuality continuum [MILG94], and this can be used to perform comparisons between various forms of mixed reality by placement onto a spectrum. At one end of the continuum is the physical world, the other end is fully synthetic virtual environments, and AR is located somewhere in between since it is a combination of the two. Figure 2‑1 is adapted from Milgram and Kishino’s continuum, with example pictures at different locations on the reality-virtuality spectrum but showing the view from the same location. The first image in Figure 2‑1 shows a view of the physical world seen through a head mounted display, with no virtual information at all. The next image is augmented reality, where artificial objects (such as the table) are added to the physical world. The third image is augmented virtuality, where physical world objects (such as a live display of the user’s view of the world) are added into a fully immersive virtual environment. The final image depicts a completely synthetic environment, with no information from the physical world being presented. Every type of 3D environment can be placed somewhere along this spectrum and can be used to easily compare and contrast their properties.
To overlay 3D models on to the user’s view, a mobile AR system requires a HMD to be combined with a device that can measure the position and orientation of the user’s head. As the user moves through the physical world the display is updated by the computer in real-time. The accuracy of the virtual objects registered to the physical world influences the realism of the fusion that the user experiences. A major focus of current AR research has been achieving good registration, as discussed extensively in survey papers by Azuma [AZUM97a] and Azuma et al. [AZUM01]. There are a number of known problems that cause poor registration, such as tracker inaccuracies, HMD misalignment, and delays in the various stages of rendering from the trackers to the display.
While registration is important for producing AR applications that are realistic (giving the user a sense of presence and hence being more immersive and easier to use) it is not the only important issue in AR research. Other questions, such as how do users interface with these systems, and what kind of tasks can systems perform, are also important and make the registration research useable for building real world applications.
1.2 Applications
During the evolution of technologies such as virtual reality and augmented reality, there have been a number of applications developed that demonstrate the use of this technology. In the field of augmented reality, this research work initially began indoors where hardware is able to be large and consume considerable electrical power without imposing too many restrictions on its use. As hardware has become smaller in size and more powerful, researchers are demonstrating more complex systems and are starting to move outdoors. This section discusses various applications that have been developed for both indoor and outdoor environments, approximately arranged in chronological order where possible.
1.2.1 Indoor augmented reality
For
indoor augmented reality, there are a number of applications that have been
developed in areas as diverse as information display, maintenance,
construction, and medicine. These applications are used to provide extra
situational awareness information to users to assist with their tasks. By
projecting data onto the vision of a user, information is shown in situ in the
environment and the user can better understand the relationship the data has
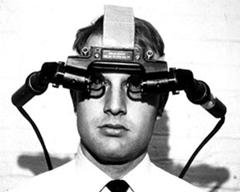
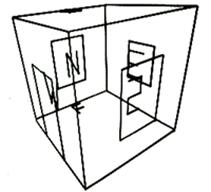
with the physical world. The first working AR demonstration was performed using
a HMD designed by Sutherland [SUTH68] and is shown in Figure 2‑2. This
HMD is transparent, in that the user can see the physical world as well as
computer-generated imagery from small CRT displays overlaid using a half
silvered mirror. So while the goal of the Ultimate Display concept was to
completely immerse the user’s senses into a virtual environment, Sutherland
actually invented the addition of information (augmented reality) with the development
of this display. Sutherland’s demonstration projected a simple wire frame cube
with line drawn characters representing compass directions on each wall. Other
see through HMDs were developed for use in military applications, with examples
such as the Super Cockpit project by Furness [FURN86]. The use of HMDs was
designed to improve on existing heads up displays (HUD) in military aircraft,
providing information wherever the user is looking instead of just projected
onto the front of the glass windshield. Similar technology is used to implement
displays for virtual reality, except these are opaque and do not use the
physical world to provide extra detail.
|
|
|
Figure 2‑2 The first head mounted display, developed by Ivan Sutherland in 1968 (Reprinted and reproduced with permission by Sun Microsystems, Inc) |
|
|
|
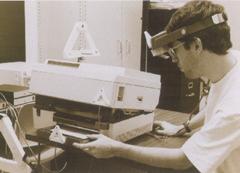
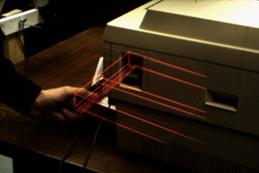
Figure 2‑3 External and AR immersive views of a laser printer maintenance application (Images courtesy of Steven Feiner – Columbia University) |
The KARMA
system was developed by Feiner et al. as a test bed for the development of
applications that can assist with 3D maintenance tasks [FEIN93a]. Instead of
simply generating registered 3D graphics from a database to display
information, KARMA uses automatic knowledge-based generation of output
depending on a series of rules and constraints that are defined for the task.
Since the output is not generated in advance, the system can customise the
output to the current conditions and requirements of the user. One example
demonstrated by Feiner et al. was a photocopier repair application (shown in
Figure 2‑3) where the user is presented with detailed 3D instructions
showing how to replace toner and paper cartridges.
|
|
|
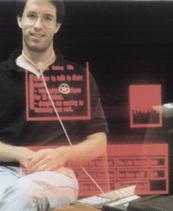
Figure 2‑4 Virtual information windows overlaid onto the physical world (Image courtesy of Steven Feiner – Columbia University) |
The Windows on the World work by Feiner et al. demonstrated the overlay of windows with 2D information onto an AR display [FEIN93b]. While traditional AR systems render 3D information, this system is based on 2D information in an X Windows server. Windows of information can be created in the X server and then attached to the display, the user’s surround, or the physical world. As the user moves about the 3D environment, the system recalculates the position of the windows on the HMD. Since the system is based on X Windows, any standard X application can be used and information always appears facing the user with no perspective warping. Figure 2‑4 shows an example of 2D information windows attached to different parts of the environment.
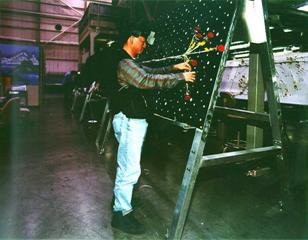
One of
the first commercially tested applications for augmented reality was developed
by the Boeing company to assist with the construction of aircraft [CURT98]. One
task performed by workers is the layout of wiring bundles on looms for
embedding into the aircraft under construction. These wiring looms are
complicated and so workers must constantly refer to paper diagrams to ensure
the wires are placed correctly. Curtis et al. describe the testing of a
prototype AR system that overlays the diagrams over the wiring board so that
workers do not have to take their eyes away from the task. Although it was
never fully deployed in the factory, this research is a good demonstration of
how AR technology can be used to assist workers with complicated real world
tasks.
|
|
|
Figure 2‑5 Worker using an AR system to assist with wire looming in aircraft assembly (Image courtesy of David Mizell – Boeing Company) |
|
|
|
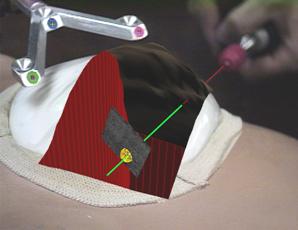
Figure 2‑6 AR with overlaid ultrasound data guiding doctors during needle biopsies (Image courtesy of Andrei State – University of North Carolina, Chapel Hill) |
Using AR
to assist doctors with medical imaging is an area that shows much promise in
the near future. A current problem with X-ray and ultrasound images is that
they are two dimensional and it is difficult to spatially place this
information easily within the physical world. By overlaying this information
onto the patient using AR, the doctor can immediately see how the imaging data
relates to the physical world and use it more effectively. State et al. have
been performing research into the overlay of ultrasound images onto the body to
assist with breast biopsies [STAT96]. During the biopsy, a needle is injected
into areas of the body that the doctor needs to take a sample of and analyse.
Normally, the doctor will take many samples and hope that they manage to
achieve the correct location, but damaging areas of tissue in the process.
Using AR, the ultrasound overlay can be used to see where the biopsy needle is
relative to the area of interest, and accurately guide it to the correct
location. This results in less damage to the surrounding tissue and a greater
chance of sampling the desired area. Figure 2‑6 shows an example of a
needle being inserted into a simulated patient with overlaid ultrasound
imagery.
|
|
|
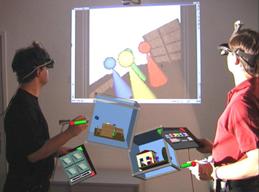
Figure 2‑7 Studierstube AR environment, with hand-held tablets and widgets (Images courtesy of Gerhard Reitmayr – Vienna University of Technology) |
Schmalstieg
et al. [SCHM00] and Reitmayr and Schmalstieg [REIT01a] describe a collaborative
augmented reality system named Studierstube, which can perform shared design
tasks. In this environment, users can work together to perform tasks such as
painting objects and direct manipulation of 3D objects, as shown in Figure 2‑7.
To provide users with a wide range of possible operations, the user carries a
Personal Interaction Panel (PIP) [SZAL97]. The PIP can be constructed using
either a pressure sensitive tablet or a tracked tablet and pen combination, and
the AR system then overlays interactive widgets on top of the tablet. Using the
pen on the tablet, the user can control the widgets that are linked up to
various controls affecting the environment.
|
|
|
Figure 2‑8 Marker held in the hand provides a tangible interface for viewing 3D objects (Images courtesy of Mark Billinghurst – University of Washington) |
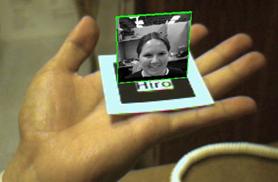
The
ARToolKit was developed by Kato and Billinghurst to perform the overlay of 3D
objects on top of paper fiducial markers, using only tracking data derived from
captured video images [KATO99]. Using this toolkit, a number of applications
have been developed that use tangible interfaces to directly interact with 3D
objects using the hands. Billinghurst et al. [BILL99] use this toolkit to
perform video conferencing, with the user able to easily adjust the display of
the remote user, as shown in Figure 2‑8. Another application that uses
this technology is Magic Book by Billinghurst et al. [BILL01]. Each page of the
magic book contains markers that are used to overlay 3D objects with AR. By
pressing a switch on the display the user can be teleported into the book and
experience immersive VR. Magic Book integrates an AR interface (for viewing the
book from a top down view with a tangible interface) with a VR interface (for
immersively flying around the book’s 3D world).
|
|
|
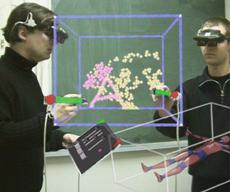
Figure 2‑9 Actors captured as 3D models from multiple cameras overlaid onto a marker (Image courtesy of Adrian Cheok – National University of Singapore) |
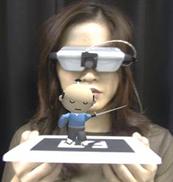
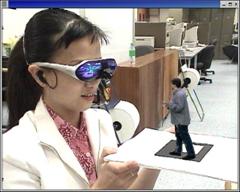
The 3D Live system by Prince et al. [PRIN02] captures 3D models of actors in real-time that can then be viewed using augmented reality. By arranging a series of cameras around the actor, Virtual Viewpoint software from Zaxel [ZAX03] captures the 3D geometry using a shape from silhouette algorithm, and then is able to render it from any specified angle. 3D Live renders this output onto ARToolKit markers, and live models of actors can be held in the hands and viewed using easy to use tangible interfaces, as shown in Figure 2‑9. Prince et al. explored a number of displays for the system, such as holding actors in the hands on a card, or placing down life sized actors on the ground with large markers.
1.2.2 Outdoor augmented reality
While indoor examples are useful, the ultimate goal of AR research is to produce systems that can be used in any environment with no restrictions on the user. Working outdoors expands the range of operation and has a number of unique problems, discussed further in Section 2.9. Mobile outdoor AR pushes the limits of current technology to work towards achieving the goal of unrestricted AR environments.
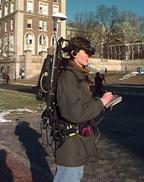
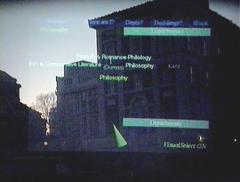
The first
demonstration of AR operating in an outdoor environment is the Touring Machine
(see Figure 2‑10) by Feiner et al. from Columbia University [FEIN97]. The
Touring Machine is based on a large backpack computer system with all the
equipment necessary to support AR attached. The Touring Machine provides users
with labels that float over buildings, indicating the location of various
buildings and features at the Columbia campus. Interaction with the system is
through the use of a GPS and head compass to control the view of the world, and
by gazing at objects of interest longer than a set dwell time the system
presents further information. Further interaction with the system is provided
by a tablet computer with a web-based browser interface to provide extra
information. The Touring Machine was then extended by Hollerer et al. for the
placement of what they termed Situated Documentaries [HOLL99]. This system is
able to show 3D building models overlaying the physical world, giving users the
ability to see buildings that no longer exist on the Columbia University
campus. Another feature is the ability to view video clips, 360 degree scene
representations, and information situated in space at the site of various
events that occurred in the past.
|
|
|
Figure 2‑10 Touring Machine system overlays AR information in outdoor environments (Images courtesy of Steven Feiner – Columbia University) |
|
|
|
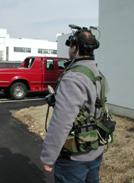
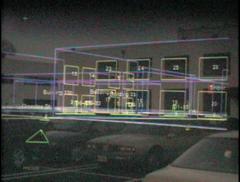
Figure 2‑11 BARS system used to reduce the detail of AR overlays presented to the user (Images courtesy of Simon Julier – Naval Research Laboratory) |
The Naval
Research Laboratory is investigating outdoor AR with a system referred to as
the Battlefield Augmented Reality System (BARS), a descendent of the previously
described Touring Machine. Julier et al. describe the BARS system [JULI00] and
how it is planned for use by soldiers in combat environments. In these
environments, there are large quantities of information available (such as
goals, waypoints, and enemy locations) but presenting all of this to the
soldier could become overwhelming and confusing. Through the use of information
filters, Julier et al. demonstrate examples (see Figure 2‑11) where only
information of relevance to the user at the time is shown. This filtering is performed
based on what the user’s current goals are, and their current position and
orientation in the physical world. The BARS system has also been extended to
perform some simple outdoor modelling work [BAIL01]. For the user interface, a
gyroscopic mouse is used to manipulate a 2D cursor and interact with standard
2D desktop widgets.
|
|
|
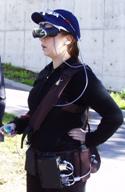
Figure 2‑12 Context Compass provides navigational instructions via AR overlays (Images courtesy of Riku Suomela – Nokia Research Lab) |
Nokia research has been performing research into building outdoor wearable AR systems, but with 2D overlaid information instead of 3D registered graphics. The Context Compass by Suomela and Lehikoinen [SUOM00] is designed to give users information about their current context and how to navigate in the environment. 2D cues are rendered onto the display (as depicted in Figure 2‑12). Other applications such as a top down perspective map view have also been implemented by Lehikoinen and Suomela [LEHI02]. To interact with the system, a glove-based input technique named N-fingers was developed by Lehikoinen and Roykkee [LEHI01]. The N-fingers technique provides up to four buttons in a diamond layout that can be used to scroll through lists with selection, act like a set of arrow keys, or directly map to a maximum of four commands.
Apart from the previously mentioned systems, there are a small number of other mobile AR systems that have also been developed. Billinghurst et al. performed studies on the use of wearable computers for mobile collaboration tasks [BILL98] [BILL99]. Yang et al. developed an AR tourist assistant with a multimodal interface using speech and gesture inputs [YANG99]. Puwelse et al. developed a miniaturised prototype low power terminal for AR [POUW99]. Behringer et al. developed a mobile AR system using COTS components for navigation and control experiments [BEHR00]. The TOWNWEAR system by Satoh et al. demonstrated high precision AR registration through the use of a fibre optic gyroscope [SATO01]. The DWARF software architecture was designed by Bauer et al. for use in writing mobile outdoor AR applications [BAUE01]. Cheok has developed some outdoor games using AR and the 3D Live system discussed previously [CHEO02a] [CHEO02c]. Cheok has also developed accelerometer-based input devices such as a tilt pad, a wand, and a gesture pad for use with wearable computers [CHEO02b]. Fisher presents an authoring toolkit for mixed reality experiences and developed a prototype outdoor AR system [FISH02]. Ribo et al. developed a hybrid inertial and vision-based tracker for use in real-time 3D visualisation with outdoor AR [RIBO02]. Roberts et al. are developing a prototype for visualisation of subsurface data using hand held, tripod, and backpack mounted outdoor AR systems [ROBE02]. The use of AR for visualisation of archaeological sites was performed by Vlahakis et al. [VLAH02].
1.3 See through display technology
As previously mentioned, this dissertation focuses on the use of HMDs to merge computer-generated images with the physical world to perform augmented reality. This section describes the HMDs and other supporting technology necessary to display AR information, implemented using either optical or video combination techniques. These techniques are described and then compared so the applications of each can be better understood.
1.3.1 Design factors
Rolland et al. [ROLL94], Drascic and Milgram [DRAS96], and Rolland and Fuchs [ROLL00] describe in detail the technological and perceptual issues involved with both optical and video see through displays. These authors identified a number of important factors that need to be considered when selecting which technology to use for an application, and these are as follows:
1.3.1.1 Technological issues
· System latency – the amount of time taken from when physical motion occurs to when the final image reflecting this is displayed.
Real-scene resolution and distortion – the resolution that the physical world is presented to the user, and what changes are introduced by the optics.
Field of view – the angular portion of the user’s view that is taken up by the virtual display, and whether peripheral vision is available to the user.
Viewpoint matching – the view of the physical world may not match the projection of the 3D overlay, and it is desirable to minimise these differences for the user.
Engineering and cost factors – certain designs require complex optics and so tradeoffs must be made between features and the resources required to construct the design.
1.3.1.2 Perceptual issues
· Perceived depth of overlapping objects – when virtual objects are drawn in front of a physical world object, it is desirable that the virtual objects perform correct occlusion.
Perceived depth of non-overlapping objects – by using depth cues such as familiar sizes, stereopsis, perspective, texture, and motion parallax, users can gauge the depth to distant objects.
Qualitative aspects – the virtual and physical worlds must be both rendered and these images must preserve their shape, colour, brightness, contrast, and level of detail to be useful to the user.
Depth of field – When physical and virtual images are passed through optics they will be focused at a particular distance. Keeping the image sharp at the required working distance is important for the user.
1.3.1.3 Human factors issues
· User acceptance and safety – if the display attenuates the physical world it could be unsafe to use in some environments since the user’s vision system is not being supplied with adequate information to navigate.
Adaptation – some displays have limitations that can be adjusted to by humans over time, and can be used as an alternative to improving the technology if there are no harmful side effects.
Peripheral field of view – the area outside the field of view of the virtual display is not overlaid with information, but is still useful to the user when navigating in the physical world.
1.3.2 Optically combined see through displays
The
design of an optically combined see through HMD system may be represented by
the schematic diagram in Figure 2‑13, although in practice the design is
much more complex due to the internal optics required to merge and focus the
images. A small internal LCD screen or CRT display in the HMD generates an
image, and an optical combiner (such as a half silvered mirror or a prism)
reflects part of the light into the user’s eyes, and allowing light from the
physical world to pass through to the eyes as well.
|
|
In general, most current AR systems based on optically combined displays share the following properties:
· Optical combiners are used to merge physical and virtual world images.
The computer generates an overlay image that uses black whenever it wants the pixels to be see-through, and so the images are simple and can be rendered quickly.
The physical world light is seen by the user directly and has high resolution with an infinite refresh rate and no delay, while the generated image is pixelated and delayed.
The physical world remains at its dynamic focal length, while the overlay image is fixed at a specific focal length.
Accurate registration of the image with the physical world is difficult because the computer cannot monitor the final AR image to correct any misalignments.
Ghosting effects are caused by the optical combiner since both virtual and physical images are visible simultaneously (with reduced luminance), and obscuring the physical world with a generated image cannot typically be performed.
The field of view of the display is limited by the internal optics, and distortions increase at larger values.
The front of the display must be unoccluded so that the physical world can be seen through the HMD.
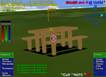
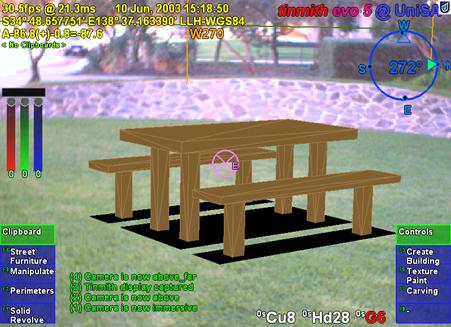
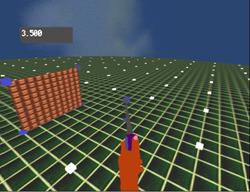
An example image from an optically combined AR system is shown in Figure 2‑14, with a 3D virtual table overlaying the physical world. Some of the problems with the technology are shown by the ghosted image and reflections, caused by sunlight entering the interface between the HMD and the lens of the camera capturing the photo.
Recent
technology has improved on some of the problems discussed in this section.
Pryor et al. developed the virtual retinal display, using lasers to project
images through an optical combiner onto the user’s retina [PRYO98]. These
displays produce images with less ghosting effects and transmission losses than
an LCD or CRT-based design. Kiyokawa et al. produced a research display that
can block out the physical world selectively using an LCD mask inside the HMD
to perform proper occlusion [KIYO00].
|
|
1.3.3 Video combined see
through displays
|
|
Video combined see through HMD systems use video cameras to capture the physical world, with virtual objects overlaid in hardware. This technique was first pioneered by Bajura et al. in 1992 [BAJU92]. An example implementation is depicted in the schematic in Figure 2‑15, with a video camera capturing images of the physical world that are combined with graphics generated by a computer. The display for this technique is opaque and therefore the user can only see the physical world through the video camera input. The combination process can be performed using two different techniques: using chroma-keying as a stencil to draw the video where AR pixels have not been drawn, or using the computer to draw the AR pixels on top of the video. The final image is then displayed to the user directly from an LCD or CRT display through appropriate optics.
In general, most current AR systems based on video combined displays share the following properties:
· The display is opaque and prevents light entering from the physical world, making it also possible to use for virtual reality tasks with no modifications required.
Some form of image processing is used to merge physical and virtual world images. Real-time image transformations may be necessary to adjust for resolution differences, spherical lens distortions, and differences in camera and display position.
The capture of the physical world is limited to the resolution of the camera, and the presentation of both physical and virtual information is limited to the resolution of the display. The final image viewed by the user is pixelated and delayed, with consistency between physical and virtual depending on whether the camera and display have similar resolutions.
The entire image projected to the user is at a constant focal length, which while reducing some depth cues also makes the image easier to view because the focus does not vary between physical and virtual objects.
More accurate registration may be achieved since the computer has access to both incoming and outgoing images. The computer may adjust the overlay to improve registration by using a closed feedback loop with image recognition.
The image overlay has no ghosting effects since the incoming video signal can be modified to completely occlude the physical world if desired.
By using video cameras in other spectrums (such as infra-red or ultraviolet) the user can perceive the physical world that is not normally visible to the human eye.
Demonstrations to external viewers on separate monitors or for recording to tape is simple since the video signal sent to the HMD may be passed through to capture exactly what the user sees.
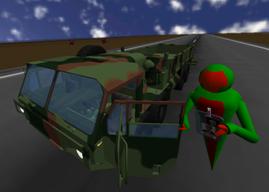
An
example image from a video combined AR system is shown in Figure 2‑16,
with a 3D virtual table overlaying the physical world. Slight blurring of the
video stream is caused by the camera resolution differing from that used by the
display.
|
|
1.3.4 Comparison
Table 2‑1 lists a summary of the information presented concerning optical and video combination techniques, comparing their features and limitations. Neither technology is the perfect solution for AR tasks, so the appropriate technique should be selected based on the requirements of the application.
Table 2‑1 Comparison between optical and video combined AR systems
1.4 3D tracking technology
To render graphics that are aligned with the physical world, devices that track in three dimensions the position and orientation of the HMD (as well as other parts of the body) are required. A tracker is a device that can measure the position and/or orientation of a sensor relative to a source. The tracking data is then passed to 3D rendering systems with the goal being to produce results that are realistic and match the physical world as accurately as possible. There have been a number of survey papers in the area: Welch and Foxlin discuss the state of the art in tracking [WELC02], Holloway and Lastra summarise the technology [HOLL93], and Azuma covers it as part of a general AR survey [AZUM97a]. This section covers the most popular technologies for tracking, with a particular focus on the types that are useful when working outdoors. This section is by no means a complete discussion of tracking and does not present new tracking results. I simply use currently available devices in this dissertation to provide tracking for my applications.
There are a number of different tracking technologies used, varying by the number of dimensions measured and the physical properties used. Holloway and Lastra discuss the different characteristics of various tracking systems [HOLL93], and these are summarised as follows:
· Accuracy – the ability of a tracker to measure its physical state compared to the actual values. Static errors are visible when the object is not moving, while dynamic errors vary depending on the motion of the object at the time.
Resolution – a measure of the smallest units that the tracker can measure.
Delay – the time period between reading inputs, processing the sensor data, and then passing this information to the computer. Large delays cause virtual objects to lag behind the correct location.
Update rate – the update rate measures the number of data values per second the tracker can produce. Faster update rates can perform smoother animation in virtual environments.
Infrastructure – trackers operate relative to a reference source. This reference may need to be measured relative to other objects to provide world coordinates useful to applications.
Operating range – trackers are limited to operating within a limited volume defined by the infrastructure. Signals emitted by sources attenuate rapidly over distance, which limits the range of operation.
Interference – various tracking technologies use emissions of signals that can be interfered with by other sources. External interference can be difficult to cancel out and affects the accuracy of results.
Cost – trackers range in price depending on complexity and the accuracy provided.
In this section, various aspects of the above factors will be discussed, along with the following extra factors:
· Degrees of freedom – trackers measure a number of degrees of freedom, being able to produce orientation, position, or some combination of these as results.
Coordinate type – some trackers measure velocity or acceleration that requires integration to produce relative-position values. When integrating values that are not exact, errors accumulate over time and cause drift. Absolute values do not require integration and are stable over time.
Working outdoors has a number of problems that are not noticed when dealing with indoor tracking systems. The use of tracking equipment in an indoor environment is simplified due to known limitations of the working environment. Alternatively, when working outdoors the environment is virtually unlimited in size and setting up infrastructure may be difficult. The use of technology that is required to be mobile restricts further the choices of tracking devices available. Azuma discusses in detail many problems to do with performing tracking outdoors [AZUM97b], and some extra factors to consider for comparison are:
· Portability – the device must be able to be worn by a person for use in a mobile environment, so weight and size are important.
Electrical power consumption – the tracking system must be able to run using batteries and not have excessive power requirements.
One of the main points stressed by Welch and Foxlin [WELC02] and Azuma et al. [AZUM98] is that to obtain the best quality tracking and to minimise any problems, hybrid tracking should be used. Since no tracking technology is perfect, hybrid trackers combine two or more different types of technologies with varying limitations to produce a better overall tracker. The last part of this section discusses some hybrid systems in detail.
1.4.1 Mechanical
Mechanical trackers rely on a physical connection between source and object, producing absolute position and orientation values directly.
The first tracker developed for interactive 3D computer graphics was the mechanical “Sword of Damocles” by Sutherland along with his new HMD [SUTH68]. This tracker is a mechanical arm with angle sensors at each joint. By knowing the length of each arm segment and the measured angle at each joint, the position and orientation of the tip of the arm can be calculated relative to the base. Measuring angles at a mechanical joint is very accurate with only very slight delays. Due to the mechanical nature of the device, the motion of the user is restricted to the length of the arm and the various joints that connect it together. The arm is quite heavy for a human and so while counterweights help to make it lighter, the inertia of the arm requires the user to perform movements slowly and carefully to avoid being dragged about and injured.
Sutherland also demonstrated a wand like device to use for 3D input when using the HMD. This device uses a number of wires connected to pulleys and sensors that measure location information. While much more lightweight, this device requires that the wires not be touched by other objects in the room as well as the user, and so the user must take this into account when moving about the room, restricting their motion.
1.4.2 Accelerometers
Accelerometers measure linear forces applied to the sensor and are source-less, producing relative-position values through double integration. Accelerometers can measure absolute pitch and roll when measuring acceleration caused by gravity.
Accelerometers are small and simple devices that measure acceleration forces applied to an object along a single axis, discussed in detail by Foxlin et al. [FOXL98a]. Modern accelerometers are implemented using micro-electro-mechanical systems (MEMS) technology that have no moving parts and can be embedded into small IC sized components. Accelerometers vibrate small elements internally and measure applied forces by sensing changes in these vibrations. To acquire velocity this value must be integrated, and then integrated again if relative position is required. The advantages of accelerometers are that they require no source or infrastructure, support very fast update rates, are cheap to buy, have low power requirements, and are simple to add to a wearable computer. The main disadvantage of this technology is that the process of integrating the measurements suffers from error accumulation and so within a short time period the values drift and become inaccurate. Due to the rapid accumulation of errors, accelerometers are not normally used standalone for position tracking. Accelerometers are commercially available from companies such as Crossbow [XBOW02].
When three accelerometers are mounted orthogonally to each other, a tilt sensor is formed that can measure the pitch and roll angles toward the gravity vector. Since gravity is a constant downward acceleration of approximately 9.8 ms-2 on Earth, orientation can be calculated by measuring the components of the gravity force that is being applied to each accelerometer. The tilt sensor output is vulnerable to errors caused by velocity and direction changes since these applied forces are indistinguishable from gravity.
1.4.3 Gyroscopes
Gyroscopes measure rotational forces applied to the sensor and are source-less, producing relative-orientation values through integration.
The first gyroscopes were mechanical devices constructed of a wheel spinning on an axis. Gyroscopes are induced to maintain spinning on a particular axis once set in motion, according to the laws of conservation of angular momentum. When an external force is applied to a gyroscope, the reaction is a motion perpendicular to the axis of rotation and can be measured. Gyroscopes are commonly used for direction measurements in submarines and ships, being accurate over long periods of time but typically very large and not portable.
Gyroscopes may also be constructed using MEMS technology and contain an internal vibrating resonator shaped like a tuning fork, discussed in detail by Foxlin et al. [FOXL98a]. When the vibrating resonator experiences rotational forces along the appropriate axis, Coriolis forces will cause the tines of the fork to vibrate in a perpendicular direction. These perpendicular forces are proportional to the angular velocity and are measured to produce output. Since each gyroscope measures only one axis of rotation, three sensors are mounted orthogonally to measure all degrees of freedom. To gain absolute orientation the velocity from the sensor must be integrated once, but this drifts over time and is not normally used for standalone orientation tracking. These devices are similar to accelerometers in that they require no source or infrastructure, support very fast update rates, are cheap to buy, have low power requirements, and are simple to add to a wearable computer. Another common name for these devices is a rate sensor, and companies such as Crossbow [XBOW02] manufacture gyroscopes for a wide range of non-tracking related commercial uses.
The most accurate gyroscope technology is based on lasers and the change in phase of photons that occurs between two intersecting laser beams and a detector. A Ring Laser Gyroscope (RLG) uses mirrors to bounce a laser beam around back to a detector, while a Fibre Optic Gyroscope (FOG) uses a coil of fibre optic cable wrapped around a rotation axis back to a detector. When a change in rotation occurs, the photons will take slightly more or less time than under no motion, and by measuring the phase difference and integrating it the total motion and hence relative orientation can be calculated. The TISS-5-40 FOG described by Sawada et al. [SAWA01] exhibited results with attitude better than ±0.1 degrees and heading drift less than 1 degree per hour. In comparison, MEMS-based gyroscopes drift by a degree or more within minutes of time passing (or even less).
1.4.4 Ultrasonic
Ultrasonic tracking measures the time of flight of ultrasonic chirps from transmitter sources to microphones, producing absolute position and orientation values directly.
While the mechanical tracker developed by Sutherland for use with his HMD was accurate and fast [SUTH68], the weight of the device was difficult to work with and had limited motion due to the mechanical linkages. Sutherland also developed an acoustic tracker which was not tethered, and worked by sending out pulses of ultrasonic sound from the head, and measuring the time of flight to reach numerous sensors dispersed across the ceiling. While the tracker worked and demonstrated the possibilities of tracking without cumbersome mechanical linkages, problems were encountered with the ultrasonic pulses interfering with each other.
Ultrasonic tracking is limited by the properties of the pulses sent for time of flight detection. Noise in the environment caused by the jingling of keys will cause the tracker to fail, and environmental effects such as wind reduce the quality of the results [WELC02]. Since the pulses travel at the speed of sound, delays in tracking increase as the sensor moves away from the transmitter. By relying on the speed of sound, environmental effects such as temperature, humidity, and air currents can have an impact on the accuracy of the measurements.
While time of flight can produce accurate position values in a room using triangulation, calculating orientation is more difficult because multiple transmitters and receivers must be adequately spaced apart to get an accurate result. Furthermore, the orientation updates are quite slow compared to other technology. Foxlin et al. [FOXL98b] mentions that in the Constellation tracking system, the orientation values are combined with accelerometers and gyroscopes using a Kalman filter to increase the update rate and smooth the output.
1.4.5 Passive magnetic
Passive magnetic tracking measures the forces generated by the Earth’s magnetic field as a source, producing absolute heading values directly.
When a freely suspended ferromagnetic object is exposed to a magnetic field, it will rotate so that its magnetic domains are in opposing alignment to the applied field. The Earth generates a magnetic field and a ferromagnetic object can be used to find the directions of the north and south poles of this field anywhere on the planet. By attaching a measuring scale to a freely suspended ferromagnetic object (to form a compass), the orientation of a tracking device can be determined relative to magnetic north. A compass is mechanical and due to the inertia of the magnet and attached parts, there is a settling time where the user of the device must wait to make an accurate reading. Electronic trackers have been constructed that use mechanical parts, but a more efficient method is to use solid state components.
A magnetometer is a solid state electronic device that can detect magnetic fields. As a magnetic field passes through a coil of wire, this produces an induced current that is proportional to the strength of the field and the incident angle to the coil. By aligning three magnetometers orthogonally, the direction to magnetic north can be calculated. These devices do not have inertia like the mechanical equivalent and so produce faster and more accurate results. Solid state magnetometers are available from a number companies such as Crossbow [XBOW02], who manufacture them for a number of non-tracking related commercial uses. Since the Earth’s magnetic field exists everywhere on the surface, no infrastructure is required to be setup and there is no range limitation. Although the magnetic field produced by the Earth is quite strong, at the surface it is relatively weak when compared to the field produced by a local magnetic source. When other ferromagnetic objects are brought close to a magnetometer, the Earth’s magnetic field is distorted locally and this affects the measurements of the sensor.
1.4.6 Active magnetic
Active magnetic tracking measures the magnetic fields generated by a local transmitting source, producing absolute position and orientation values directly.
Rather than just relying on weak magnetic fields generated by the Earth to perform direction sensing, a tracking device may generate its own powerful local magnetic field. The tracking sensor measures this local magnetic field to determine position and orientation measurements between the sensor and source. The first tracker to implement this technique was designed in the 1970s to be used inside aircraft cockpits by Polhemus [POLH02], and is discussed by Raab et al. [RAAB79]. This technology uses three magnetometers arranged orthogonally as with a passive magnetic tracker, and a transmitter to generate a field for it to detect. The transmitter is constructed with three magnetic coils also arranged orthogonally, and each coil is pulsed with an AC signal to generate a magnetic field that is then detected by the sensor coils. By pulsing each transmitter coil separately and measuring the response in the sensor coils, both position and orientation can be reconstructed with good accuracy at close distances. A limitation of the AC signals used by Polhemus trackers is that changing eddy currents form in nearby metal objects and this causes distortions in the measured results. With this limitation in mind, one of the original engineers left the company to create a new company to fix these problems. The new company, Ascension Technologies [ASCE02], developed trackers that were similar but uses a DC pulse that generates stable eddy currents in nearby metal. To improve accuracy further, measurements from the sensors when the transmitter is not active are used to measure background magnetic fields. With these two improvements, magnetic tracking is less susceptible to interference by metal but it is still a problem. Both Polhemus and Ascension trackers work in environments where the tracking range is reasonably small and cables must be used to connect both the transmitter and multiple sensors to the controller unit.
1.4.7 Global positioning system
GPS tracking measures the time of flight of signals from satellites in space to the user, producing absolute position values directly.
The Global Positioning System (GPS) was developed by the US military to provide reliable and real-time navigation information not previously available using existing methods such as dead reckoning and celestial navigation. The system is based on a constellation of 24 satellites that orbit the Earth, each transmitting specially encoded radio waves that contain highly accurate timing information. A receiver unit (with knowledge of the current position of the GPS satellites) can calculate its position by measuring the time of flight of these signals from space. The GPS satellites broadcast on two frequencies, L1 at 1575.4 MHz and L2 at 1227.6 MHz, and can penetrate atmospheric effects such as cloud, rain, smoke, smog, dust, and air pollution [MCEL98]. These frequencies are blocked by physical objects such as buildings and tree canopies, and so GPS cannot be reliably used amongst these objects. Encoded onto these signals are P-code for military users, C/A code for civilian users, and navigation messages containing satellite information. The L1 channel is intended only for civilian use (containing C/A and navigation messages) while L2 is designed for military use along with L1 and contains the more precise P-code information. Previously, the L1 channel was intentionally degraded by the US military using Selective Availability (SA) but this has now been deactivated. Another navigation system that is operated by the Russian Federation is the Global Navigation Satellite System (GLONASS), which operates in the same way as GPS but with different frequencies, satellite geometry, and signal encoding. Some GPS receivers also come with the ability to use GLONASS satellites to improve accuracy, although GLONASS cannot be currently used standalone because only a small number of the full constellation of satellites are in orbit.
The positioning quality resulting from a GPS receiver depends on the accuracy of the processing performed in the receiver as well as other external effects. The quality of the receiver is important because the time of flight measurements and position calculations rely on having an accurate internal clock and high resolution floating point unit. Using three satellites and an accurate atomic clock makes it possible to find the position of the user, but if the clock is not accurate (as is the case with commercial grade units) then an extra satellite is required to resolve the ambiguity. Further errors are introduced by particles as well as magnetic and electrical effects in the atmosphere that affect L1 and L2 bands. GPS uses time of flight and so cannot derive orientation, except when multiple sensors are spaced sufficiently far apart. This technique is not normally used except on large scale construction projects such as bridge building where adequate distances between sensors can be obtained.
Consumer grade GPS receivers come in a variety of form factors, from tiny embedded OEM chip designs to hand-held units with information displays such as the Garmin GPS 12XL [GARM99]. The accuracy of consumer grade GPS units vary depending on environmental conditions, but with the use of differential GPS (DGPS) radio signals, accuracies of 5-10 metres at one update per second can be achieved. DGPS signals are generated by a base station that measures the difference between its known surveyed position and reported GPS position, transmitting corrections for each satellite to GPS receivers located within a few hundred kilometres.
With the development of GPS, surveyors have started to use it for their work but require greater accuracy than is possible with DGPS enabled consumer grade receivers. By improving the quality of the internal receiver, the accuracy of GPS calculations can be improved. For example, the Trimble Ag132 [TRIM02] uses signal processing algorithms to filter out GPS signals reflected from nearby objects (referred to as multi path correction) and to compensate for some errors introduced by the atmosphere. By using clocks and processors more accurate than consumer grade units, as well as DGPS corrections, the accuracy of position measurements is improved to around 50 cm at a rate of 10 updates per second.
Even with these improved GPS units, Allison et al. discuss the use of Real-time Kinematic (RTK) techniques to further improve the accuracy of GPS tracking [ALLI94]. RTK GPS units can achieve accuracy in the range of 1-2 centimetres at 30 updates per second, obtained by counting the number of wavelengths between the satellite and the receiver, and using extra L2 frequency information. As the GPS antenna is moved around, the receiver closely monitors the phase changes in the signal and uses the count of the wavelengths to provide 1-2 centimetre accuracy. Although encrypted, the L2 signal still contains some timing information that can be extracted and RTK correlates this with the normal L1 signal. RTK also uses similar correction techniques as discussed previously and requires a secondary surveyed DGPS source located within a few hundred metres.
A number of different coordinate systems are used for representing locations on Earth, and are discussed extensively in the Geodetic Datum of Australia Technical Manual [ICSM00]. Polar coordinates have been traditionally used by navigators and surveyors and are the most logical for working with a planet that approximates a slightly flattened spheroid. Latitude is measured in degrees north/south from the equator, and longitude is measured in degrees east/west from the prime meridian. Distance from the centre of the Earth is not required in many cases because the user may be assumed to be located on the spheroid surface. A number of different spheroid parameter models (datums) have been developed for representing coordinates on an imperfectly shaped Earth, such as AGD66, AGD84, and WGS84. Polar coordinates are output natively by GPS systems and I refer to these coordinates as LLH (latitude-longitude-height) values.
An alternative to using polar coordinates is the use of Cartesian coordinates relative to the centre of the Earth, referred to as ECEF values. These coordinates are represented in metres as XYZ values, with Z passing through the geographic north pole, X through the equator and prime meridian, and Y through the equator and 90 degrees east. ECEF coordinates are commonly used to transform between coordinate datums but are unintuitive for use by humans. While LLH values only require latitude and longitude to specify position (where height can optionally be assumed to be on the spheroid), ECEF values require all 3 components to be useful at all. For working in small local areas, surveyors have developed special coordinate systems and projections using metres as units with an approximate flat Earth model, referred to as the Universal Transverse Mercator (UTM) grid. The Earth is divided up into a number of zones, each with separate origins so that coordinates within can be expressed easily. UTM coordinates are specified as northings and eastings values in metres from a local origin, and are simple to handle using standard trigonometry. ECEF and UTM coordinates are both useful when dealing with 3D renderers, which are designed to operate using Cartesian and not polar coordinates. There are a number of standard algorithms for accurately converting between LLH, ECEF, and UTM coordinates, although they are beyond the scope of this dissertation and described elsewhere [ICSM00].
1.4.8 Optical
Optical tracking can be implemented using active sources or passive features, producing either relative or absolute values depending on the technology in use. Trackers that use a known source such as a transmitter or fiducial marker produce absolute values directly. Source-less trackers require integration to produce relative orientation and position values.
When navigating outdoors, humans primarily rely on their eyesight to capture images of the local environment and match these against previous memories to work out their current position. By using information known about the world as well as cues such as occlusion, relative size, relative density, height, environmental effects, motion perspective, convergence, accommodation, and binocular disparities [CUTT95], people estimate the size and relative position to visible objects. There are current investigations to perform similar operations with video cameras and computer-based vision systems to estimate both position and orientation information. This research involves a number of disciplines such as artificial intelligence and computer vision, and is currently not mature enough to produce a tracker capable of working under arbitrary motion [AZUM01].
For environments where features are not known in advance, a number of techniques have been developed that attempt to perform full position and orientation tracking based on arbitrary objects in the scene. Some examples of these markerless trackers are by Simon et al. [SIMO00], Simon and Berger [SIMO02], Genc et al. [GENC02], and Chia et al. [CHIA02]. These researchers have developed algorithms for finding parts of the scene to track and calculate the motion of the user. There are many problems that include selecting appropriate features to track, dealing with the unexpected movement of non-static objects, blurred images caused by high speed motion, varying lighting conditions, distinguishing between translation and rotation, and drift of the integrated results over time. Bishop describes a tracking system implemented in a custom integrated circuit that measures optical flow at orders of magnitude faster than using video cameras, reducing drift and blur problems [BISH84]. Behringer attempted to match silhouettes on the horizon against those generated from local terrain models for orientation sensing, although suffers from the horizon being obscured by objects such as buildings and trees [BEHR98].
The most successful optical tracking methods so far all involve the use of markers that are placed in the environment for image recognition methods to detect. State et al. discuss problems similar to those mentioned earlier, and that fiducial markers or landmarks simplify the computations needed to analyse the image [STAT96]. Since landmark tracking still has problems with robustness, State et al. use magnetic tracking as the primary source and then correct it with tracking from live video streams. The magnetic tracker simplifies the vision tracking mechanism by providing an estimate for the location of the markers. The markers can then be used to extract out more precise position and orientation values that are pixel accurate. An alternative technique used in other systems is to drag the overlay image in 2D to align with the markers. This is much simpler but produces less accurate results because rotation and depth effects are not handled.
The ARToolKit software library has been developed by Kato and Billinghurst for use in tangible mixed reality applications [KATO99]. Using a single fiducial marker printed on paper, position and orientation information can be extracted from individual video frames. The markers are black squares with a white inner area that can contain a non-symmetrical pattern. By analysing the edges to measure perspective change, the rotation of the pattern, and the distance from the camera, the algorithm can extract tracking information in real-time. This algorithm is simple in that it requires only a single marker for tracking, and generates results that appear to overlay the marker correctly but may be inaccurate from other view points. This software is not intended to be used to implement accurate 6DOF tracking systems and other techniques should be used instead. ARToolKit is widely used in many research applications and is available under the GNU Public License, while others remain proprietary.
1.4.9 Hybrid outdoor
Based on the discussions of various tracking technologies in this section, it can be seen that there is no one technology that is able to perform accurate tracking standalone. As discussed earlier, Welch and Foxlin [WELC02] and Azuma et al. [AZUM98] agree that for the implementation of the ultimate tracker, hybrids will be required since each technology has limitations that cannot otherwise be overcome. Tracking outdoors is also even more difficult than indoors because the variables that affect the tracking cannot be controlled as easily. By combining two or more sensor technologies using an appropriate filter, these limitations may potentially be overcome to produce a tracker that is accurate over a wider range of conditions. Many commercial tracking systems implement some kind of hybrid tracking and these will be discussed in this subsection.
For position sensing, strap-down inertial navigation systems (INS) are constructed using a combination of three orthogonal gyroscopes and three orthogonal accelerometers [FOXL98a]. Accelerometers can measure 3D translations in sensor coordinates but the orientation of the sensor in world coordinates must be known to calculate the translation in world coordinates. By integrating the gyroscope values the orientation can be found and used to compensate for gravity in the accelerometers and then to calculate the INS position in world coordinates. The INS is not a complete tracking system however, since all the sensors are only relative devices and are affected by drift. Errors in any of the sensed values will affect other calculations and so introduce additional accumulating errors over time.
For
measuring orientation, a simple example is the TCM2 digital compass from
Precision Navigation [PNAV02], shown in Figure 2‑17. The TCM2 uses
magnetometers to measure the angle of the device to magnetic north, and also
tilt sensors based on accelerometers to measure the angle relative to the gravity
vector downwards. Each sensor is not capable of measuring the values the other
can, and so by combining them full 3DOF orientation values can be measured.
These values are absolute and do not drift over time, making them ideal for AR
applications, although are relatively low speed, include a lot of noise in the
output, and the magnetic heading can be easily distorted by large metal
objects.
|
|
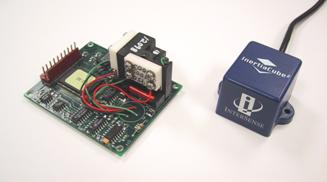
Again for measuring orientation, Foxlin and Durlach [FOXL94] followed by Foxlin et al. [FOXL98a] developed the InertiaCube, which combines the tilt sensing properties of accelerometers with rate sensing gyroscopes (see the previously discussed INS) to produce full 3-axis orientation values. This device requires no infrastructure (apart from gravity to supply an absolute reference for the tilt sensor) and is very small and portable. A filter is used to combine the tilt sensor values with the drifting gyroscopes to produce absolute orientation values with the desirable properties from both sources. Since the heading information is not corrected with an absolute sensor, this value will drift over time while the others remain stable.
To compensate for problems associated with the previous two hybrid orientation trackers, Foxlin combined the InertiaCube sensor with a 3-axis magnetometer (similar to the TCM2). The specially designed Kalman filter reads in all the sensor values and combines them to correct for errors that occur under different conditions. This device is sold as the InterSense IS-300 and InertiaCube2 [ISEN03], and is shown in Figure 2‑17. Both of these devices produce absolute values that do not drift over time since correction is performed on all orientation axes. The relative values then provide smooth and high speed output under fast motion. Azuma also produced a similar tracker that combined a three axis gyroscope with a TCM2 magnetic compass [AZUM99]. A limitation of these hybrids is if the sensor is exposed to local magnetic distortions for a considerable time, the Kalman filter will incorrectly calibrate the gyroscopes and introduce errors into the output.
1.4.10 Comparison
Table 2‑2 lists a summary of the information presented concerning 3D tracking technologies, comparing their features and limitations. As described previously, there is no one perfect tracking technology and so combinations of these are typically required.

Table 2‑2 Comparison between various types of 3D tracking technology
1.5 Desktop direct manipulation techniques
In 1963, Sutherland produced the Sketchpad system [SUTH63] that had a revolutionary interface for its time. Instead of using the computer for batch processing or using a keyboard to enter interactive commands, he developed a new user interface that allowed users to draw graphical objects and manipulate them using a light pen on a display. The interactions occur in real-time, and use what is now referred to as direct manipulation to let the user control the system.
A second important piece of early work was the Put-That-There system by Bolt, where a user may interact with data in a room using simple pointing gestures and speech commands [BOLT80]. The goal of this system was to allow a user sitting in a chair to interact with information projected onto the walls. This system used Polhemus magnetic trackers for the pointing, a speech recognition computer with a pre-programmed grammar for interpreting commands, and a data wall showing information of interest to the user.
The term direct manipulation was first defined by Shneiderman, involving the continuous representation of application data as objects that can be manipulated with an input device [SHNE83]. Other important properties are that operations are rapid, incremental, and reversible with immediate feedback, and usable by both novice and expert users. The most powerful direct manipulation interfaces use analogies that a user can easily relate to, such as turning a dial or dragging a box, and are more intuitive than command-based interfaces. Johnson et al. describes direct manipulation using another guideline: “Data objects should be selected and operated on by simulated physical contact rather than by abstract verbal reference” [JOHN89].
One of the first and most complete implementations of a direct manipulation-based user interface was the Xerox Alto project, later released commercially as the Xerox Star [JOHN89]. This system uses a keyboard and monitor like many others, but for the first time implemented what is referred to as the desktop metaphor. Rather than a user invoking tools to perform operations, the system abstracts these concepts to that of an office and working with documents. Instead of using a command line interface, the user controls the system by directly manipulating icons and dialog boxes presented on the display, using a mouse to simulate physical contact. The presentation of the display was also novel by using a high resolution graphical display, with windows for displaying documents and abstract graphical representations of data. The Xerox Star system inspired many other WIMP user interfaces such as the Macintosh and Windows, which are still used today. It is important to realise that not all systems with a mouse and windows are necessarily desktop-based. Only those systems that abstract away operations on data files to an office desktop metaphor meet this criteria [JOHN89]. For example, X Windows and TWM are only 2D windowing environments for running applications. Systems such as the Macintosh, Windows, KDE, and GNOME are all desktop environments. This dissertation uses the term 2D desktop more generally to refer to any computer system that is placed on a desk. These systems use a mouse-like input device, a keyboard for command entry, and a monitor for the display of information.
1.6 Virtual reality interaction techniques
This section discusses the evolution of interaction techniques for virtual reality, starting from the development of the first HMDs and tracking devices to the current state of the art. The main focus of this section is on the user interfaces that have been developed, with the majority of the research systems described performing the modelling of 3D objects. Modelling applications are good examples for research because they require complicated user interfaces with efficient and easy to use techniques. Applications that can perform 3D modelling are also still an area of research, as discussed by Brooks [BROO97]. This chapter will only review the introduction of techniques to the VR area, since the previously reviewed AR systems borrowed their interfaces from similar VR systems.
1.6.1 Initial work
After working on the Sketchpad system, Sutherland presented a new idea that he termed the Ultimate Display [SUTH65] in 1965, when computer graphics was still in its infancy. The goal was to create an interface that would provide data for all the senses of a human, fully immersing them into a simulated reality that does not exist. As previously mentioned, in 1968 Sutherland produced the first HMD [SUTH68], which was transparent and able to overlay the physical world with a simple wire frame cube and labels. To track the motion of the HMD a mechanical tracker was used, giving the user real-time 3D graphics based on their point of view. A 3D input wand with a wire filament tracker (described previously) was used to perform simple interactions with the environment. While the display and graphics were primitive by today’s standards, this is the first demonstrated example of technology for virtual and augmented reality.
Although humans are able to understand 2D views of 3D information, VR is based on the notion that it is more intuitive to hold a 3D object in the hands or to walk around and view an object from different angles. Trying to create and edit 3D information using only a 2D view is cumbersome, and a HMD allows intuitive user interfaces based on the motion of the body. A number of research papers (that will be discussed later in this subsection) such as [CLAR76], [SACH91], [BUTT92], and [LIAN93] all have the common theme that 3D direct manipulation interfaces are superior to 2D-based environments that impose limitations on operations that are naturally 3D.
The first interactive 3D editing application on a HMD was a surface editor by Clark [CLAR76] that made use of the HMD, wand, and mechanical trackers designed by Sutherland. This system removes the need for keyboard commands and numeric entry of data that was common in previous 3D systems. A user wearing a HMD can walk around to get different views of a spline surface, and then manipulate points interactively using a wand. This allows designers to freely explore changes to the surface using the direct manipulation metaphor, and focus on the task of designing a suitable surface. Clark concluded his paper with the comment that “3-D computer-aided surface design is best done in real-time with 3-D tools. To expect a designer of 3-D surfaces to work with 2-D input and viewing devices unnecessarily removes a valuable degree of freedom”.
The systems presented by Sutherland and Clark demonstrated important ideas but the technology was too cumbersome for regular use. With the availability of new technology, Fisher et al. implemented the Virtual Environment Display System [FISH86], using a stereo HMD with a wide field of view that matches the capabilities of the human vision system, and active magnetic tracking (discussed previously) that allows much more freedom of motion. To interact with the system, speech recognition for commands and a tracked pair of gloves for direct 3D manipulation is used. While the direct manipulation of objects is intuitive, the level of sophistication of the user interface was very primitive compared to the state of the art methodologies available for 2D interfaces, such as the Xerox Star [JOHN89].
1.6.2 3D modelling systems
Although Clark’s surface editor [CLAR76] was the first demonstration of modelling using a HMD and 3D input device, it was quite primitive due to its limited functionality compared with existing CAD systems. Later research was performed using 3D tracked input devices to improve usability but still used 2D desktop monitors as displays. These systems allow the user to directly manipulate 3D objects, but do not use the body to move around the environment. Later research then used immersive VR displays that supported the full use of the body to interact with the environment.
Sachs et al. presented a system named 3-Draw [SACH91], which allowed users to perform 3D modelling tasks using a pair of 6DOF tracked Polhemus sensors: one held in the hand as a stylus and the other attached to a tablet. The model being created is positioned relative to the tablet and is represented on a desktop monitor. By rotating and moving the tablet, various views of the object may be seen interactively. Using the tracked stylus, the user can sketch curves in 3D and then deform them into various shapes. Since both stylus and tablet are tracked the user can freely manipulate them to get the best view for comfortable modelling. Although allowing the interactive specification of views, the view cannot be moved beyond the range of the tracker, limiting the size of the modelling universe. Sachs et al. made the observation that “the simultaneous use of two sensors takes advantage of people’s innate ability - knowing precisely where their hands are relative to each other”. Sachs et al. demonstrated that by using 3D input, encouraging results were achieved when compared to existing 2D techniques used by CAD systems. Sachs et al. also state that their approach of focusing on the modelling task was more efficient than working at the non-intuitive control point level where direction and magnitude must be specified manually.
The JDCAD 3D modelling system also uses a desktop monitor as a display, and Liang and Green identified a number of key problems with the use of 2D input devices for 3D modelling, justifying the use of 3D input devices [LIAN93]. A designer using a 2D input device must break down 3D problems into unnatural 2D steps, therefore changing their thinking to suit the modelling tool. Some examples are creating vertices by using the cursor from two different view points, or rotating objects one axis at a time using widgets. Another insightful comment made from testing JDCAD was that users found it hard to control all six degrees of freedom (position and especially rotation) at the same time. Being able to constrain position and orientation separately is useful - while having only 2D inputs is limiting for a designer, full 6DOF controls can be hard to control accurately. Compared to the previously discussed 3-Draw system that is limited to the work area of the tablet, JDCAD implements techniques for flying and action at a distance. These techniques allow the user to perform modelling tasks at any location and obtain arbitrary views of objects. Pioneering techniques (described later) were also developed for selection and manipulation of objects out of arm’s reach, and the execution of commands using 3D menus.
Using techniques
developed in previous work, Butterworth et al. developed a fully immersive
HMD-based modelling system named 3DM [BUTT92]. The use of traditional keyboards
and mice is no longer available when immersed in VR, and so alternative user
interface techniques are required to interact with the system. 3DM was the
first immersive system to support a user interface with 3D menus and tool
palettes. The interface performs the selection of options using direct
manipulation, similar to traditional desktop user interfaces. The authors state
that the application was inspired by the ease of use of the interface for the
MacDraw program, which uses similar menus and toolbars. 3DM is able to create
simple geometric objects such as cylinders, boxes, and cones, and triangle
strips. During the process of creation, as well as during edit operations, the
user may directly manipulate these objects at a number of levels: vertices,
objects, and groups of objects in hierarchies. For objects that are too far
away or at a size that is difficult to work with, the user’s scale and location
in the world can be adjusted as desired by the user. The 3D menus and tool
palettes pioneered in 3DM are concepts still used in many VR applications.
|
|
|
Figure 2‑18 CDS system with pull down menus and creation of vertices to extrude solids (Images courtesy of Doug Bowman – Virginia Polytechnic Institute) |
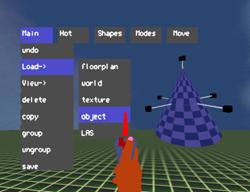
The CDS
system designed by Bowman [BOWM96] takes concepts from VR described previously,
and extends these with extra features for the construction of new objects at a
distance. Rather than just placing down objects within arm’s reach, CDS is
capable of projecting points against the ground plane using a virtual laser
beam originating from the user’s hand, as shown in Figure 2‑18. The
points on the ground plane can then be connected together using lines and
extruded upwards to form solid shapes.
|
|
|
Figure 2‑19 CHIMP system with hand-held widgets, object selection, and manipulation (Images courtesy of Mark Mine – University of North Carolina, Chapel Hill) |
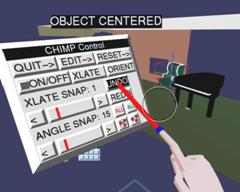
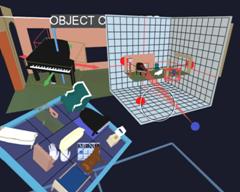
Mine et
al. produced the CHIMP system [MINE97a], integrating many of the techniques
from previous VR systems (such as laser pointing, 3D widgets, and menus) as
well as the concept of proprioception, the intuitive knowledge the user has
about objects placed on or near the body. Rather than working at a distance,
CHIMP is designed to allow users to interact with the environment within arm’s
reach, since humans are more adept at working within this range. To interact
with objects at a distance, Mine et al. introduced the concept of scaled world
grab, where the world is scaled so that the selected object appears at a
workable size in the hand. The user can then easily adjust the object with widgets
that are within arm’s reach, such as shown in Figure 2‑19. By placing
items such as menus and tools near the body, the user can reach out and grab
them using proprioception without having to see them directly with the eyes.
Users can indicate commands that are similar to the physical world using
intuitive gestures.
|
|

|
Figure 2‑20 Immersive and external views of the SmartScene 3D modelling environment (Images courtesy of Paul Mlyniec – Digital ArtForms Inc) |
SmartScene from Multigen [MULT01] is a commercial 3D immersive modelling system and is shown in Figure 2‑20. It implements many of the techniques presented previously, combining them together to produce a powerful 3D modelling system that is capable of performing a wide range of tasks on both HMD and projector displays. It uses direct manipulation, tool palettes, menus, scaled world operations, and the creating and editing of geometry in real-time, controlled using two 6DOF tracked pinch gloves.
1.6.3 VR modelling interaction techniques
This subsection presents a detailed summary of interaction techniques that are currently used in VR modelling systems. The previous discussion only mentioned the development of the most notable systems over time, while this subsection introduces the many techniques contributed by various researchers. Techniques are discussed for interaction within arm’s reach, action at a distance, and command entry. Bowman and Hodges [BOWM97] and Poupyrev [POUP98] both provide surveys and comparisons of some of the 3D manipulation techniques discussed.
1.6.3.1 Direct manipulation
The most intuitive way to manipulate objects in a VR system is to use the concept of direct manipulation - reaching out and grabbing an object using a tracked prop with buttons or a set of gloves with finger press sensors. When an object is selected, it is slaved to the user’s hand and can be freely translated and rotated in all 6DOFs. The implementation of operations such as flying, scaling, and grabbing using affine transformations in a scene graph is discussed by Robinett and Holloway [ROBI92]. Based on existing direct manipulation work in 2D user interfaces, the next natural progression is to implement concepts such as menus, tool palettes, and icons, as implemented first by Butterworth et al. in 3DM [BUTT92].
Conner et al. introduced the concept of 3D widgets[CONN92], based on extensive previous work in the 2D desktop area. Conner et al. define a widget as being an encapsulation of geometry and behaviour, with different widgets implementing a range of geometry and behaviours. Widgets were first introduced in 2D user interface toolkits to assist with application development, designed to abstract away the user interface from the program performing the task. By extending this concept to 3D, Conner et al. propose the development of 3D user interface toolkits with similar goals in mind, but supporting more powerful interactions using the extra DOFs available. Since 3D environments contain a number of extra DOFs, the definition of 3D widgets is much more complex than in previous 2D environments.
With research by Mine et al. into working within arm’s reach and proprioception [MINE97a], the use of hand-held widgets was proposed as a way of efficiently adjusting controls in the environment. Instead of grabbing and rotating an object at a distance, the user grabs an object and it appears in their hands with various widget handles around it. Using the other hand, the user can then grab handles to perform operations such as scaling or rotation. This interaction is much more efficient because users are familiar with the concept of holding a physical object in one hand and manipulating it with the other hand. By holding 3D dialog boxes in the hands, users can manipulate widgets to enter values and perform operations that have no direct mapping with the physical world. Mine et al. also introduce the concept of storing interaction widgets relative to the body that the user intuitively knows where to find using proprioception. For example, to access a menu the user lifts their hand into the air and pulls down, causing the menu to be dragged down into view. To delete an object, the user grabs it and uses a throwing over the shoulder gesture.
While direct manipulation may seem intuitive, one problem is the lack of haptic feedback. Users are familiar with reaching out and feeling an object while grabbing it, making virtual grabbing difficult because the user can only rely on visual cues for feedback. Interacting with user interface objects such as tool palettes and menus is also difficult due to the same lack of haptic feedback. Another limitation of direct manipulation is that if the object is not within arm’s reach, the user must walk or virtually fly to a location that is closer. When walking or flying is not possible, alternative metaphors to direct manipulation are required.
1.6.3.2 Command entry
In some cases it is not possible to express an operation using an intuitive direct manipulation operation. Operations such as selecting a lighting model or adjusting the number of triangles used in a primitive have no physical world counterpart and so an abstraction must be introduced. Brooks offers an insight into what interactions are suitable for different operations in virtual environments [BROO88]. For cases where a discrete interactive change to a virtual world parameter is required, Brooks suggests the use of menu selections. For dynamically changing parameters, dynamic input devices should be used instead. The only time Brooks recommends character-based commands be used is when retrieving an object by name or attaching a name to an object. In general, designers of VR and AR systems should avoid using keyboard entry where possible because command-based systems are highly abstract and unintuitive.
Brooks also suggests that the specification of commands and operations in the view area should be separate and assigned to different cursors, since it “interrupts both the visual and tactile continuity inherent in the operand cursor’s natural movement”. Using this methodology, the command interface can be changed to other formats without affecting the interactions in the view. Brooks suggests that command selection is also a natural candidate for speech recognition engines. As previously mentioned, the Put-That-There system by Bolt implemented an interface that used separate hand tracking for pointing and speech recognition for command entry [BOLT80].
Liang and Green implemented the first 3D interaction menus, named Daisy and Ring [LIAN93]. The Daisy menu presents a series of commands arranged evenly around a sphere, and by rotating the input device the desired menu option can be moved to within a selection basket and a button pressed. Liang and Green found that rotating a Polhemus sensor about all 3 axes was difficult because of the hanging cable and so developed an improved menu. The Ring menu presents the options in a ring shape (so there are fewer options than with Daisy) and only one DOF is used to rotate the ring and move an item into the selection basket. The Ring menu was demonstrated to improve usability even though fewer options are available at any time. The HoloSketch system by Deering also uses ring style menus, and is used to support a stereo desktop 6DOF modelling application [DEER95]. Deering’s 3D pie menus pop up around the 6DOF cursor when a wand button is pressed, and the user then moves the wand to the desired option and selects it. Sub-menus are supported by pushing the menu back and floating a new pie menu on top. These pie menus are designed to use accurate position tracking and minimise both travelling distance and screen real estate by appearing around the wand.
As discussed earlier, Butterworth et al. [BUTT92] and Mine et al. [MINE97a] both implement 3D menus and tool palettes that appear in front of the user. The user indicates 3D items with their hands to directly make selections, but requires accurate tracking to be usable. The pull down menus and tool palettes implemented are structured similar to those used in 2D desktop style user interface toolkits. This form of command entry can be quite tiring if the user is constantly reaching out in front of their body to make selections, and lacks the haptic feedback that is expected by the user.
Bowman and Wingrave developed a VR menu system [BOWM01] that employs Pinch Gloves [FAKE01] as the input device. Instead of using a pull down menu, the top-level items are mapped to the fingers on one hand and the second-level options to the other hand, with no 3D tracking of the hands required. The user selects a top-level option with the matching finger, the system updates the display with a list of second-level options, and the user then picks one using the other hand’s fingers. Using their small finger, the user can cycle through options if there are more than three options available. This menu design is limited to a depth of two, and is not easily scalable to a large number of hierarchical commands.
Instead of using a menu or tool palette to execute commands, Zeleznik’s SKETCH system uses a three button 2D input device to sketch out 3D pictures using gestures [ZELE96]. Hand gestures are analysed to initiate various commands such as selection, manipulation, and deletion. Gesture-based inputs are limited to working in environments where fast and accurate tracking is available, and to a limited set of commands that are expressed using real life actions. When abstract concepts that have no logical gesture mapping are performed, unintuitive gestures must be created and learned, or less direct interfaces such as those discussed previously must be used.
Wloka and Greenfield developed a device named the Virtual Tricorder, a generic tool that can be used to perform many operations in VR [WLOK95]. This device is tracked in 3D and contains a set of input buttons that are mapped to different operations. By overloading the device’s operations the number of tools to be carried is reduced while increasing the functionality. The Virtual Tricorder is limited to the number of buttons that are available, and the overloading of functionality may become complicated for the user to understand.
1.6.3.3 Lasers and spotlights
In many cases it is inconvenient or not possible to fly to an object to be directly manipulated. In the JDCAD system [LIAN93], Liang and Green developed a number of techniques that were later described by Mine using the term action at a distance [MINE95b]. Rather than directly manipulating the object, the user can manipulate it through pointing. The first technique Liang and Green developed is virtual laser pointing, and allows the intuitive selection of objects by projecting a virtual laser from the hands toward an object, just as can be achieved in the physical world. Once the object is selected, it may be attached to the laser beam like a long rod and manipulated by rotating the hand. While this technique can perform remote manipulation very intuitively, it suffers from the amplification of fine hand movements and tracker noise to large motions at a distance. Other transformations such as rotation along an arbitrary axis or varying the distance along the laser beam are also not supported without further extensions to the technique. Bowman and Hodges implemented a fishing reel metaphor that can adjust object translation toward and away from the user after selection [BOWM97]. Liang and Green discovered that at large distances and with small objects the thin laser beam was difficult to select with, mostly due to the amplification of tracker noise. The spotlight technique was then developed, using cone shapes that increase in radius over distance.
Forsberg et al. improved on the spotlight technique to create a new technique named selection apertures [FORS96]. Rather than using a laser or cone originating from the user’s hand, this technique originates a cone from the user’s head, with the axis of the cone passing through the cursor on the user’s hand. A circular selection cursor mapped to the user’s hand defines the radius of the cone at the hand, affecting the overall size of the selection cone. An interesting property of this technique is that the cone does not originate from the hands, and so only the position of the cursor is required instead of full 6DOF tracker values. Devices with poor orientation sensing can be used, and selection accuracy can be improved since the user is looking through a virtual scope rather than aiming a virtual laser from the waist.
1.6.3.4 Non-linear hand mappings
Another alternative to the direct manipulation of objects is by mapping the user’s hand to a selection cursor using a non-linear function. Mine first described such techniques [MINE95a], and discussed how the location of the hands can be used to control the velocity of a cursor flying through the environment. If the user moves their hand beyond a central point, the object will move away with increased velocity, and by bringing their hand closer the object will move toward the user. This technique is similar to using a joystick to control the motion of the cursor, except this technique is in 3D and uses the hands. The use of joystick controls adds a layer of abstraction from direct manipulation that may degrade performance in the environment.
The GoGo arm [POUP96] was developed by Poupyrev et al. as a way of manipulating objects at a distance with a similar technique as described by Mine, but using absolute position values instead of a velocity abstraction. This technique uses the volume within reach of the user’s hands and maps the closest two thirds directly to the cursor for direct manipulation. The remaining one third of the volume away from the user is mapped to a non-linear quadratic function that increases rapidly with distance. The overall function used has a smooth transition and allows working within arm’s reach and at long distances without changing modes. Since this technique controls a 3D cursor, it can be used for both selection and manipulation, although the accuracy of the technique will degrade according to the function used as the distance is increased.
1.6.3.5 Image plane techniques
On a standard desktop display, 3D objects can be selected with a mouse by positioning the 2D cursor on top of the object of interest. To select an object, the system finds the intersection with all objects underneath the cursor and returns the closest one. This technique can also be used in virtual environments by placing the cursor over an object at a distance, and projecting a selection ray from the head through the hand cursor. Pierce et al. describe these as image plane techniques [PIER97], and indicate how they can be used to perform selection of objects out of arm’s reach. Four selection techniques are proposed: head crusher, sticky finger, lifting palm, and framing hands, as an alterative to previous laser and spotlight techniques. Although Pierce et al. did not discuss manipulation of objects using this technique, the same mechanism (as in laser and aperture selection) can be used to adjust the position and orientation of the object at a distance. An interesting comment from the discussion of an informal user study by Pierce et al. is that “no user has had any trouble understanding how the techniques work”, and that arm fatigue is minimised since hand selection time is reduced compared to other VR techniques.
1.6.3.6 Scaled world techniques
Rather than trying to extend the direct reach of a user with the use of extensions such as laser beams and non-linear mappings, Stoakley et al. proposed a new interaction metaphor named Worlds-in-Miniature [STOA95]. In this metaphor, the user holds a small copy of the 3D world in their hands. By viewing the WIM in the hands, objects that are currently obscured in the immersive VR view can be easily seen from overhead. Objects in the WIM can also be manipulated directly using the hands, with these changes made visible in the immersive VR view. The advantage of this technique is that it can perform selection and manipulation tasks using direct manipulation, even through the object may be very far away from the user. For cases where the world is very large however, the WIM model must be scaled to fit the user’s hand and so small objects may be invisible to the user.
The scaled world grab technique by Mine et al. [MINE97a] uses similar concepts to perform remote interactions within arm’s reach. After selecting an object the entire world is scaled and translated so that the object of interest appears in the hand. The user can then interact with the object and others nearby, with the world being returned back to its original scale when finished. Since the entire world is scaled during the grab operation, the user can still see other nearby objects and there is no need to divide up screen space between a WIM and the immersive view.
Another technique designed to overcome the shortcomings of WIMs is the Voodoo Dolls technique by Pierce et al. [PIER99]. In this technique, the user works in a standard immersive view and then selects an object of interest. When selected, the system creates a unit sized “doll” in the hands that represents the object in the environment. Changes made to a doll held in the hand are reflected immediately in the normal environment. When dolls are held in both hands, the dolls are scaled around the non-dominant doll of unit size. By varying the position and rotation of the hands the relative placement of the dolls can be adjusted in the environment. Dolls can be created by selecting, released by letting go with the hands, and passed between the hands. To provide context for the user, the dolls are rendered with the selected object as well as others that are close by.
1.6.3.7 Prop-based input
Users intuitively know how to manipulate objects in the physical world, and so by using tracked physical props these can be used as user interaction devices. Previously mentioned work normally uses gloves or button controllers to interact with the environment, but these are generic devices that do not have real world equivalents. Hinckley et al. demonstrated evaluations of using props for the visualisation of 3D models of the brain [HINC94b]. A small doll’s head with an embedded Polhemus sensor is used to represent the brain, while a tracked cutting plane and pointer are used to select slices or points in the virtual model. The surgeon can very intuitively interact with these props since their operation is obvious and uses the surgeon’s existing manipulation skills. In other research, Hinckley et al. again demonstrated that well designed tracker props are easier to understand and use than the generically-shaped tracker sensors supplied by the manufacturer [HINC97]. The use of props can be cumbersome if there are too many discrete operations to represent, or if the task is too abstract to map to any physical world prop. The use of props also prevents the use of the hands for other tasks that may be required.
The Personal Interaction Panel developed by Szalavari and Gervautz [SZAL97] makes use of tablets as a prop-based input device, and has been used in collaborative AR work by Schmalstieg et al. [SCHM00] and Reitmayr and Schmalstieg [REIT01a]. The PIP is held in the hands and uses AR to overlay 3D widgets indicating various controls that can be adjusted with a hand-held pen (see Figure 2‑7). The tablet may be quite small and implemented using a variety of technologies such as pen tracking or pressure sensing, making it portable and easily carried. Another feature of the PIP is that it provides haptic feedback for the user as they press the pen against the tablet, in contrast to the hand-held widgets and tool palettes discussed previously. Lindeman et al. demonstrated that by providing passive-haptic feedback to the user in precise direct manipulation tasks, user performance is significantly increased [LIND99]. In this study, the best results were achieved when the user was able to hold a tablet in one hand and then press against it with a tracked finger. Other methods such as fixing the tablet to the world or having no haptic feedback produced lower user performance values.
1.6.4 Comparison
Table 2‑3 lists a summary of the information presented concerning interaction techniques for virtual reality (and also augmented reality), comparing their features and limitations.
Table 2‑3 Comparison between forms of VR interaction techniques
1.7 Physical world capture techniques
Being able to capture the physical world into a digital model has become a critical part of modern professions such as surveying, building, and architecture. These areas have traditionally used paper to record information, but over time the amount of data required has increased and now computers are used to streamline these tasks. Brooks discusses the problems associated with the capture of physical world objects from a computer graphics perspective [BROO97]. One suggestion he makes is that an iterative refinement strategy is desirable, where the most resources are focussed on complex objects and not on those that can be approximated with no noticeable loss of detail. This section discusses various techniques used to capture physical world data into a computer.
1.7.1 Surveying techniques
Surveyors are responsible for measuring and capturing the geometry of landscapes for various uses such as construction and the division of property boundaries. Using a known reference point on the Earth, coordinates of other points may be found from relative orientation and distance measurements. Originally, surveying was performed by using measuring chains, where the chain is pulled between two points and the length is calculated by counting the number of links. The accuracy of the chain is affected by its physical properties as well as distortions caused by gravity. The angle is measured using a theodolite, which resembles a small telescope mounted onto a tripod. By aiming the theodolite’s crosshairs at a target, the angle can be mechanically measured relative to the base. Laser range fingers are now also used on theodolites to instantly measure distances without the use of chains, achieving accuracies in the order of millimetres. With integrated angle and distance measurements in theodolites, quick and accurate measurements can be performed in the field.
GPS technology has also improved since its introduction and is now widely used in the surveying field as well. As previously mentioned, RTK technology allows accuracies of 1-2 centimetres and is accurate enough to be used for surveying. Using a pole-mounted GPS, surveyors can instantly record the position of an object by placing the pole down at the location and pressing a button. The use of modern equipment such as GPS, theodolites, and laser range finders enables the surveyor to be more efficient and accurate compared to traditional techniques.
1.7.2 Manual object capture
To
capture the model of a building, the most basic method is to physically measure
the structure with a tape measure, and then record the dimensions and geometry
on paper. This information can then be used to recreate the object as a 3D
graphical model using a desktop CAD system. The main problem with this
technique is that it is very time consuming, as each point needs to be manually
measured, recorded on paper, and then entered into a computer. This process is
also prone to errors, and it will only be obvious during entry into the
computer that a mistake has been made when points do not line up correctly.
Errors require the user to repeatedly go back outside and make new measurements
until the model is satisfactory. While existing plans for buildings can be used
as 3D models, Brooks points out that in many cases these plans show the object
as designed but not as actually constructed [BROO97]. Apart from just
discussing the capture of models into the computer, Brooks argues that working
with static world models is a substantial engineering task, similar in
magnitude to a software engineering task. A rule of thumb he proposes that the
complexity of an object can be measured by counting the number of polygons,
similar to counting lines of source code when programming.
|
|
|
Figure 2‑21 Partial UniSA campus model captured using manual measuring techniques (Image courtesy of Arron Piekarski) |
At the start of this thesis work, Arron Piekarski used the manual techniques described above to capture a number of buildings on the university campus. This process took about a week to achieve the level of detail and accuracy required and was used to create the AutoCAD model shown in Figure 2‑21.
1.7.3 Image-based reconstruction
Images captured with cameras from two known positions may be used to reconstruct the 3D geometry of objects. Cameras placed at even slightly different locations will receive images differently due to perspective depth effects. By matching features between the images and measuring the differences in position, 3D mesh surfaces can be automatically produced. This technique can be applied using stereo cameras at a fixed distance apart or from a single camera that is moving along a known path (such as on an aircraft or a vehicle). Sester et al. describe a number of problems with these image-based techniques [SEST00]. Environments containing large height discontinuities or occlusion by other objects will prevent features being accurately measured. If the sampled images contain repetitive patterns or lack of unique textures then matching between images becomes difficult or impossible.
Stereo cameras can only capture a 3D surface from one particular view and cannot produce a fully closed model unless multiple surfaces are merged together. The Façade system by Debevec et al. uses photographs taken from multiple view points to accurately capture the geometry and textures of objects such as buildings [DEBE96]. While the final models are completely closed surfaces compared to those produced by stereo image capture, the data must be processed offline and requires intervention by the user. The user manually specifies similar feature points between various images to assist with the processing. Image-based reconstruction is still an active research area and no fully automated techniques currently exist for arbitrary shaped objects.
1.7.4 Distance-based reconstruction
Laser scanning devices are commonly used to capture large outdoor structures, with examples such as the commercially available I-SiTE [ISIT02] and Cyrax [CYRA03] scanners. These devices sweep a laser over an outdoor area and capture distance measurements, constructing a detailed 3D mesh of the area. Since the scanner cannot view all faces of the object it must be repositioned at different view points and the resulting 3D meshes merged together. The specifications for the I-SiTE scanner claim to measure a point every 30 cm at a distance of 100 metres, and to be able to reconstruct a large building from four different angles within one hour. Laser scanners suffer from occlusion by other objects, absorption of the laser on very dark surfaces, no reflections from sharply angled surfaces, and bright reflections caused by specular surfaces [SEST00]. For objects such as buildings, laser scanning produces much more accurate results than those available from image-based reconstruction, although the scanning devices are much more expensive.
An alternative technique usually deployed from aircraft or satellites is the use of Synthetic Aperture RADAR devices (SAR). SAR sends out RADAR pulses along a range of angles and measures the returning pulse’s intensity and phase to form an image. Images are repeatedly captured as the SAR platform moves through the world, and are not obscured by clouds or trees since the visible light spectrum is not used. By matching features between images the phase differences can be used to calculate relative distances for each point on the image [SEST00]. This approach is mostly used for the capture of large areas such as mountains or cities and suffers from similar problems to stereo image reconstruction.
1.7.5 General discussion
Stereo images, laser scanning, and SAR imaging all require line of sight with the particular light spectrum to capture the geometry of objects. Any objects that are occluding the model will introduce areas of uncertainty, and some objects may include features that are self occluding, such as the pillars in front of a building. Areas that cannot be scanned will form shadows in the 3D mesh that incorrectly represent the physical world shape. If the scanner cannot be repositioned at a different angle to see around the occluding object, it will be impossible to scan correctly. While multiple 3D meshes from different view points can be merged together to form a single mesh, this is difficult and requires accurate correspondences to be made.
Scanning techniques rely on the brute force capture of millions of data points to sample objects, but for flat surfaces there will be many unnecessary points and for areas with sharp changes in features there will not be enough points. For example, when modelling a house, the doors and windows each only need a single polygon but the frames around them require highly detailed geometry to represent their structure. The capture time for models also remains the same no matter what the complexity of the object is, whether it is a simple cube or a detailed sculpture. For simple capture tasks, it is not possible to spend only a couple of minutes to capture the approximate outline of a building since the key corner points may be missed by the scanner as the step size is increased. Large models with millions of polygons are also time-consuming to render or simplify on current hardware, and so these capture processes can require extra processing to achieve the desired geometry detail.
All of the described capture techniques in this section produce 3D output that is relative to the device that performed the capturing. To provide absolute positions for the 3D model, a GPS (or some other positioning device) must be used to measure the location of the scanner. The accuracy of the final world-relative model will therefore depend on the least accurate of all the devices in use. Finally, these techniques are limited to objects that already exist in the physical world. For capturing objects that do not exist, CAD modelling tools are needed for users to express their design and visualise it.
1.8 CAD modelling
Computer Aided Design (CAD) systems are used to create accurate 2D and 3D representations of physical world objects. These systems form a core part of most design work, since the computer can perform a wide range of useful calculations and processes that help to reduce time and costs. Much research has gone into the development of these systems, and this section provides an overview of their use and underlying technologies that will be useful in later chapters of this dissertation.
1.8.1 Commercial CAD
applications
|
|
Systems used in commercial environments have evolved on 2D desktop-based machines, with a typical example of a popular system being Autodesk’s AutoCAD [ACAD03] (see Figure 2‑22). Mine reviews a wide range of CAD systems and discusses their features extensively [MINE97b]. Simple drawing systems are capable of creating 2D vector-based primitives such as points, lines, arcs, and text. CAD systems extend these primitives to support other higher-level features such as layers, dimensioning, and template objects that can be used for complex 2D designs. 3D CAD systems can be used to model real life objects using solid modelling operations. These 3D models may be analysed before construction to ensure it meets the design requirements, and then possibly sent to an automated milling machine to produce a physical representation. There are many powerful CAD tools that can perform a wide range of tasks but these will not be discussed in this dissertation.
CAD systems are generally 2D applications that project the specified view point on to a display, and allow the user to draw and edit both 2D and 3D objects. Given only a 2D input device and a keyboard, CAD systems implement a number of techniques to enter in 3D information. Using direct keyboard entry of numerical values for 3D locations is the most exact input method since there is no ambiguity. An alternative is the use of multiple views from different angles, where the user can select the same point in each view and the 3D location is calculated through intersection. CAD systems also introduced a concept named working planes that is described by Mine [MINE97b]. Working planes are surfaces of infinite size that are placed into the modelling environment, and the 2D cursor on the display is projected against these. Given any 2D cursor position, the working plane can be used to calculate 3D coordinates for other operations. Working planes can be defined using numeric input, graphically while perpendicular to a view point angle, or relative to the surface of another object.
Working planes have features that can be explained best using an example of constructing a model of a house. Given an empty model, the 2D top down view is selected and a working plane is created at height zero. The user can click a series of points to define lines forming the perimeter of the house. The user switches to a side view and then extrudes the perimeter up to create a solid shape. Inbuilt objects supplied with the CAD system such as pyramids and wedges (or previous extrusion techniques) can be used to form the roof shape. Up to now this example has only used working planes that are perpendicular to the current view. The true power of working planes is most apparent when the object cannot be aligned to the view point. In this scenario, instead of using the coordinate system to specify working planes, an object facet itself can be used. To draw a window onto a wall of the house, the user nominates the wall and then simply draws against the surface. As each point is entered it is projected against the wall (working plane) and used to create a 3D vertex. If a picture is hanging on the wall, it can be moved along the surface of the working plane instead of on the plane perpendicular to the view point. Working planes act as a constraint mechanism that assists with the specification of three degrees of freedom using only a two degree of freedom input.
1.8.2 Constructive solid geometry
While a
shape may be defined by specifying each vertex manually and then joined into
polygons, this is a very time consuming process. In many cases, it can be seen
that shapes contain surfaces similar to those in primitive objects such as
boxes, cylinders, spheres, and cones. Using constructive solid geometry (CSG)
techniques, CAD systems can take objects that are mathematically defined and
combine them using Boolean set operations. In his detailed survey paper of the
field of solid modelling, Requicha describes the foundations of using CSG
representations for 3D objects in this way [REQU80]. An example of traditional
Boolean set operations is depicted by the Venn diagrams in Figure 2‑23,
with two overlapping closed 2D regions and various logical operators. The
examples depicted are inverse, union, intersection, and difference operators.
|
|
For the examples depicted in Figure 2‑23, any kind of closed space (such as a 3D solid object) can be used instead. A point is defined as being part of a set if it is enclosed by the surface, and the region inside the surface is assumed to be a solid volume. Figure 2‑24 demonstrates similar Boolean set operations but using 3D solid objects and operating on a pyramid as object A and a sphere as object B. The union, intersect, and difference operators produce shapes that would be difficult to express otherwise and yet it is obvious what input primitives were used.
|
|
|
|
|
|
|
Pyramid A |
Sphere B |
Union (A È B) |
Intersect (A Ç B) |
Difference (A – B), (A Ç !B) |


|
(Images courtesy of Leonard Teo) |
To
simplify the calculations for computing CSG objects, the input objects should
all be definable using mathematical surface equations. Surface equations can be
used to generate polygon meshes and surface normals at any level of detail
since they are continuous functions with well defined values. 3D shapes may be
defined mathematically using equations that equal zero when the X, Y, and Z
coordinates are on the surface of the object. For example, a sphere surface of
unit dimensions can be defined using the equation x² + y² + z²
- 1 = 0. If coordinates inside the sphere are used then the equation will
return a negative value, and it will be positive for all points outside the
sphere. The surface equation of a cylinder that is infinite along the Z axis
and of unit radius in X and Y can be similarly represented using the equation x²
+ y² - 1 = 0. Similarly, the surface equation for a plane is Ax +
By + Cz + D = 0 and when zero is calculated then the point lies
exactly on the surface. The surface normal of the plane is represented in the
equation using the vector [A, B, C]. An interesting property of the plane
equation is that it is not enclosed since the plane moves off to infinity in
all directions and so one would assume that it does not have an inside or
outside. A plane does have an inside and outside though, since it possesses a
surface normal vector for direction and cuts the universe into two halves (see
Figure 2‑25). The portion above the plane is defined as outside while the
portion below is inside. The surface equations previously defined can all be
categorised as quadric surfaces, each expressed using the general equation Ax²
+ By² + Cz² + Dxy + Exz + Fyz + Gx +
Hy + Iz + J = 0. Other more exotic shapes can be represented using
this and other higher order equations, but will not be discussed here.
|
|
|
|
The definition of the infinite cylinder introduced previously is not useable for rendering since it is infinite in length while physical world objects are generally finite in length. What is desired is the ability to place end caps on the cylinder to limit its length, but this cannot be easily expressed using a single surface equation. A capped cylinder can instead be defined with the combination of a cylinder and two planes, the planes being used to provide the end caps. Using the layout shown in Figure 2‑26 it can be seen that the planes define a region bound along the Z axis, but infinite along X and Y, while the cylinder defines a region bound in X and Y, but infinite in Z. By combining these regions using the intersection operator, a new solid region that includes the common parts between all inputs is defined and appears as a capped cylinder. It is critical that the surface normals for the two planes are correctly placed pointing out from the cylinder, otherwise the final object will be non-existent since there is no common inside.
Using a
similar technique as used previously, a box can be defined using six plane
equations. Figure 2‑27 shows how these planes can be arranged so that
their inside regions all overlap – when this area is intersected a box shape is
formed. This construct is interesting because while a box shape cannot be
defined using a single quadric surface, it can be defined using a collection of
planes. Using CSG techniques, most shapes can be created given enough inputs
and iterations, making this a very powerful way of expressing objects with only
simple inputs.
|
|
One drawback to CSG is that since the objects are defined using quadric equations, they cannot be directly rendered on typical 3D graphics hardware that supports only polygons. Requicha describes in detail the use of boundary representations made up of facets to represent solid models before and after CSG operations [REQU80]. Many algorithms have been developed for the calculation of CSG boundary representations, including real-time ones such as those by Laidlaw et al. [LAID86] and Thibault and Naylor [THIB87].
1.9 Outdoor augmented reality wearable computers
This section introduces the concept of a wearable computer, and how one can be used to perform outdoor augmented reality. Wearable computers are defined, input devices are reviewed, and then the problems associated with performing mobile AR are then discussed. Much of the information presented in this section is based on knowledge I have accumulated after designing mobile computers since 1998.
1.9.1 Definition of a wearable computer
For the purposes of this dissertation, I will define a wearable computer to be a self powered computing device that can be worn on the body without requiring the hands to carry it, and can be used while performing other tasks. The first known instance of the development of a wearable computing device was in the late 1950s by Thorpe and Shannon [THOR98]. This device was used to predict the motion of roulette wheels at casinos and contained twelve transistors worn by the user, with a foot mounted switch as an input device and a small concealed earpiece for feedback. This was pioneering work because the wearable was completely hidden in clothing and able to pass the careful inspection of casino security staff.
Wearable computers have now progressed to the wearing of hardware with internal architectures similar to that available on standard computers, with systems developed by Carnegie Mellon University (such as VuMan [BASS97] and Spot [DORS02]) and the Massachusetts Institute of Technology (such as MIThreal [MITH03]). Systems are now commercially available from companies such as Xybernaut [XYBE03] and Charmed [CHAR03], and combined with a HMD are being deployed to assist workers with tasks that require information to be presented while keeping the hands free. Systems have been tested in the field with studies such as those by Siegel and Bauer [SIEG97] and Curtis et al. [CURT98]. Research such as designing for wearability by Gemperle et al. [GEMP98] and embedding wearables into business suits by Toney et al. [TONE02] are examples of research focusing on making computers a part of everyday clothing.
1.9.2 Mobile input devices
A key feature of a wearable computer is the ability for a user to operate the computer while being mobile and free to move about the environment. When mobile, traditional desktop input devices such as keyboards and mice cannot be used, and so new user interfaces are required. Thomas and Tyerman performed a survey of various input devices for wearable computers and how they can be used for collaboration tasks [THOM97a]. Thomas et al. evaluated three different input devices for text entry on wearable computers: a virtual keyboard controlled by trackball, a forearm keyboard, and a chordic keyboard [THOM97b]. While these devices demonstrated improvements in accuracy and speed after training the user, they still are not as efficient as a standard desktop keyboard. Although many devices have been developed for communication with wearable computers, there is still much research to perform in this area as the devices are still cumbersome and force the user to use unnatural interactions. Some currently available devices include:
· Chord-based keyboards (the Twiddler2 [HAND02] is shown in Figure 2‑28a)
Forearm-mounted keyboards (the WristPC [LSYS02] is shown in Figure 2‑28b)
Track-ball and touch-pad mouse devices (a generic track-ball mouse is shown Figure 2‑28c, and the Easy Cat touch-pad [CIRQ99] is shown in Figure 2‑28d)
Gyroscopic and joystick-based mouse devices (the Gyration wireless mouse [GYRA04] is shown in Figure 2‑28e)
Gesture detection of hand motions
Vision tracking of hands or other features
Voice recognition
|
|
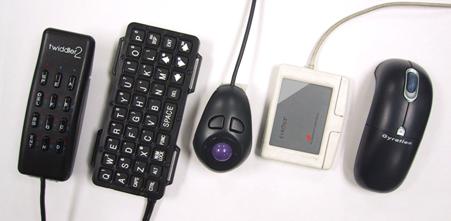
|
Figure 2‑28 Wearable input devices suitable for use in outdoor environments (a) chordic keyboard, (b) forearm keyboard, (c) track-ball mouse, (d) touch-pad mouse, and (e) gyroscopic mouse |
1.9.3 Mobile AR problems
Many wearables such as the ones discussed previously are small and can be concealed on the body, with construction that is able to survive daily use. When working with AR and interactive 3D graphics however, most wearable computers lack the computational power available on standard desktop and laptop systems to perform these tasks. Instead of using small and compact wearable computers, the applications presented in this dissertation require equipment that is bulky, power inefficient, and heavy, such as laptops, trackers, and batteries. If current trends in the miniaturisation of hardware continue, these devices will reduce in size to that of current wearable computers today. Since the equipment currently required is quite bulky, I have used a mobile backpack configuration similar to that used by Feiner et al. [FEIN97]. Although large and heavy, these are still wearable just like any other smaller computer, although are less comfortable and ergonomic.
The design of mobile backpack systems that can perform AR has a number of problems that are not experienced when working on a desktop computer. Designing a system that is powerful enough, uses mobile power sources, is able to work outside, and withstand tough environmental conditions is difficult and introduces tradeoffs. Azuma also discusses some of the problems associated with making AR work outdoors [AZUM97b]. The designs possible vary depending on the requirements, and some of the constraints are as follows:
· Weight and size - Wearable computers should not be a burden on the user to carry and use.
Power supply and run time - Components that have large electrical energy requirements need more batteries, which add to weight and size. The amount of time the system can run for is controlled by the amount of power supplied by the batteries and the efficiency of the components.
Performance - Calculations for rendering and tracking require large amounts of processing power, and to meet certain requirements larger and more energy intensive devices may be required. The power consumption of devices is directly proportional to clock speed and heat dissipation.
Ruggedness - Sensitive electronic equipment needs to be protected from the environment or it will be damaged easily. Connectors, cables, and components normally used indoors may be unsuitable outside due to forces caused by the user moving around, as well as being immersed in an atmosphere with dust, moisture, and heat.
Price - Cheaper devices are always desirable when possible.
The previous requirements are all interdependent. If the designer optimises for one particular category such as increasing performance, the weight, size, and price of the system will also increase. By optimising for low weight and small size, the wearable will not require as many batteries, but will result in the ruggedness protections being removed, diminished performance in the computer, and an increase in the price to pay for miniaturisation of the components. A standard design guideline is that when designing systems, it is possible to optimise for one case at the expense of most of the others, so there are always trade offs to be made. Mobile AR systems tend to be optimised for performance, with most other factors being sacrificed. This makes them large, energy intensive, extremely fragile, and very expensive. While technology is improving, there is still much progress to be made before these systems may be easily and commonly used.
HMDs operated in an outdoor environment also suffer from portability problems, as well as dealing with a wide and dynamic range of lighting conditions, from darkness to full bright sunlight, and effects such as shadows and reflections. For optical displays, bright lighting can cause the optical overlay to not be visible and can also enter the user’s eyes via the sides of the HMD. Darkness causes the opposite effect with the physical world not easily visible while the overlay is very bright. When working with video overlay displays, video cameras are required that can operate over wide ranges of lighting. These cameras still do not have performance even approximating that of the human eye however.
1.10 Summary
This chapter has discussed the current state of the art in AR technology. While the current level of technology is very impressive, much of this technology has been around since the time of the first HMD by Sutherland in 1968. Although there have been a number of improvements and the quality of systems has increased substantially, there are a number of unsolved and important problems that prevent mainstream use of AR applications. This dissertation will address some of the problems with user interfaces and 3D modelling tasks for AR, with a particular focus on operating in mobile outdoor environments.